
TRANSLATE: Click here for instructions on how to translate this page.
The We All Count: HWDSB Student Census was a confidential student data collection that took place from spring 2021 to early 2022. The census was intended to help HWDSB learn more about its students, with the intention to identify and address systemic barriers by focusing Board programming and resources.
All school boards in Ontario have or will conduct a student census as the Anti-Racism Act, 2017 and Ontario’s Education Equity Action Plan require school boards to gather and report this data. The student census is also a priority project in HWDSB’s Equity Action Plan.
![]()
The first stage of reporting included the census results, which were shared with the public in June 2022. The results were also translated and are available in 12 different commonly used languages at HWDSB.
The current stage of reporting now focuses on disproportionality data. We linked the student census data with other data we have in our system so we could look at different outcomes by identity category.
What is a disproportionality and why do we measure it?
Data about disproportionalities help us to understand how the education system is doing in serving different groups of students. The disproportionalities measured in this report are student outcomes including:
- Suspensions and Expulsions
- Academic Achievement
- Attendance
- Well-Being
These outcomes are directly related to the learning and experiences students receive in schools. Calculating disproportionalities allows us to compare outcomes across groups, and even across systems. A unique identity group of students may be overrepresented or underrepresented in terms of an outcome. For example, one identity group may be suspended more compared to other groups (overrepresentation) or a unique identity group may be assigned lower grades compared to other groups (underrepresentation).
Disproportionalities occur as a result of systemic inequities that are not only present in education. Systemic inequities affecting our students and families exist in our society as whole – in health, social services, legal, child welfare, and more.
This data was partially reported in the June 19, 2023 Board Meeting as part of the Safe Schools – Suspensions and Expulsions Update from the Program Committee (9-1). The full Disproportionality Data Report can be found in the tabs below.
Disproportionality Data Report
Why is it important to collect identity-based data?
Identity-based data are necessary to understand barriers created by systemic racism and other forms of discrimination in and across organizations and sectors. The Anti-Racism Data Standards (ARDS) explain that systemic discrimination occurs when organizations create or maintain inequity because of hidden biases in policies, practices, and procedures that privilege some groups and disadvantage others. For example, this can look like people in authority treating members of Indigenous, Black and racialized groups harshly or differently than others, it can look like informally or unconsciously excluding gender diverse and disabled individuals from opportunities, and it can look like not paying enough attention to issues and problems that disproportionately affect people learning English as an additional language and ethnically diverse communities.
In HWDSB, when student identity data are linked with other datasets that we have such as suspensions, attendance, achievement and well-being, we learn more about our students and their experiences in the school board. Patterns reveal how the school environment affects different students in different ways and how some groups of students are advantaged while others are disadvantaged. Understanding where students are disproportionately represented, for example, in suspensions, enables the Board to act in ways that address this problem and work toward a more equitable system.
The ARDS provide historical context for why organizations are beset with inequities and contend that:
“Throughout Canada’s history including prior to Confederation, colonial practices, including the oppression of Indigenous peoples and the enslavement of people of African descent, have entrenched public attitudes, beliefs, and practices that continue to negatively impact Indigenous, Black, and racialized individuals and communities in social, economic, and political life. The exclusion and devaluing of different groups is also evident in Canada’s history of discriminatory immigration and citizenship policies, including restricted admission for Jewish people at the height of the Holocaust; the Head Tax on Chinese immigrants; and the internment of Japanese Canadians during World War II, among many other examples.”
The Ontario Human Rights Commission, in its Policy and Guidelines of Racism and Racial Discrimination affirms that racism is tied to social, political, economic, and institutional power that is held by the dominant group in society. HWDSB recognizes that the education sector is very much shaped historically by systems of oppression and that has resulted in a system that does not support the learning and achievement of all students. Collecting identity-based data is the first step in unpacking our shared past and beginning the long work of addressing inequities, in our commitment to better serve every student.
We acknowledge that disproportionalities are not new; the data in this report confirm what many people have seen, known and experienced all their lives. We also acknowledge that unequal treatment of different identity groups across sectors (e.g., child welfare, justice, education) and in the job market along with lack of adequate supports (e.g., housing, social assistance, mental health and well-being) indicate whole systems that are lacking and, thus, perpetuate what we see in the HWDSB data.
Limitations to the Data
The We All Count: HWDSB Student Census data collection occurred during the COVID-19 pandemic (Spring 2021) and was opened again the following year to reach more students. In the end, participation included 24,177 students which is roughly half the students in the Board or 48%. Further, there were some data quality issues which meant that some responses could not be used.
It is also important to note that We All Count was voluntary. Students were not required to answer every question or to fill it out at all, and parents/guardians were provided with a mechanism to opt their child[ren] out of the survey. This, coupled with the participation rate, causes concern over how representative the data are. Critical voices may be missed in this collection. That is why we have used statistical testing along with minimum requirements for sample size before we will state that a disproportionality likely reflects what is actually happening in the Board.
This disproportionality analysis is preliminary. Some students didn’t participate in the census, and those who did are probably those who felt safe and comfortable sharing their identity data, which means the identities of those who didn’t participate for different reasons are absent. Intersectional disproportionalities could not be calculated because numbers become too small. For example, there are so few racialized students in our dataset who are also female and have a disability that we cannot use that data to draw conclusions, and there is a risk of identifying people. The disproportionality data shared on the following pages is what we consider highly likely to represent the entire student population, meaning that where we have identified disproportionalities that are statistically significant, according to the tests applied, staff is confident that we would see a very similar result if the census included data on all students in the Board and that the disproportionalities calculated are not due to chance.
Suspension Disproportionalities 2021-2022
Why is it Important?
There is a great deal of evidence in the academic research literature about school suspensions having unintended negative consequences such as lower academic achievement, school drop-out, feelings of alienation, substance use, antisocial and violent behaviour. Research also shows that suspensions feed the school to prison pipeline.
When schools suspend students disproportionately, it shows how systems (like education systems) disadvantage some groups of students and advantage others. The Ontario Human Rights Commission report on The Ontario Safe Schools Act: School Discipline and Discrimination describes this issue in Ontario. HWDSB data shows the disadvantaging of First Nations, Black, and Arabic speaking students along with boys, bisexual students and those with certain disabilities.
Background
Suspensions are reported once per year to trustees in public reports. The June 2023 report is here. It shows suspensions (and expulsions) over the last five years by infraction type. It also includes the number of students who are identified as exceptional (per Special Education guidelines) who were suspended or expelled.
Community members, parents/guardians, educators, and others who support students have expressed concerns over the disproportionate impact suspensions have had on Black students, Indigenous students, racialized students, students with disabilities and other groups of students who experience marginalization. In March 2023, community members brought concerns forward to the Board of Trustees and their presentations can be found here.
With the identity data collected through the We All Count: Student Census project, we have been able to look at suspensions in more detail to gain a better understanding of which groups of students are suspended in HWDSB.
How to read the chart
The bars on the chart represent the proportion of students who were suspended one or more times within an identity group. This means that if a student was suspended one time or five times, they are only counted here once. We compared the proportion of students who were suspended for each identity group with the proportion of all students in the Board who were suspended (represented by the orange line, also called the “board average”). When the identity group proportion is more than the Board proportion (i.e., the bar is above the orange line), it signals that students within that group are disproportionately represented in our suspension data.
The bar chart below shows trends we expect to see in the whole student population. The proportions are statistically significant and the number of students in each identity group is high enough that we can be reasonably sure these results are not due to chance. To see all identity groups and data, go to the data table included with this report.
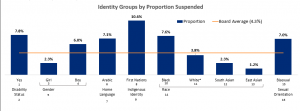
Graph Legend
| 1 | Yes | 5 | Gender | 9 | Indigenous Identity | 13 | East Asian |
| 2 | Disability Status | 6 | Arabic | 10 | Black | 14 | Race |
| 3 | Girl | 7 | Home Language | 11 | White | 15 | Bisexual |
| 4 | Boy | 8 | First Nations | 12 | South Asian | 16 | Sexual Orientation |
The suspension data included in this chart is from the 2021-2022 school year. *White is the only proportion shown here that is not significantly different from the Board average according to statistical tests but we included it for comparison.
It’s important to remember that individual students within a group have different suspension rates. Some students within a group may be suspended many times, while other students in that same group may be suspended few times or none at all.
Here is an example of how to read the results in this chart: In the “Gender Identity” category, we can see that 6.1% of students who identify as boys were given at least one suspension in the 2021-2022 school year. This proportion is higher than the Board average which means that boys are overrepresented in terms of suspensions.
Findings
- On average, schools suspend at higher rates students who identify as:
- Living with a disability (see details in Appendix B)
- Boys
- Arabic-speaking
- First Nations
- Black
- Bisexual
- On average, schools suspend at lower rates students who identify as:
- Girls
- South Asian
- East Asian
What does this mean?
The data clearly show patterns of disparity across identity groups which means that some students are being disadvantaged due to discriminatory and unfair disciplinary practices. There are initiatives in place to begin the work of developing bias-free, progressive disciplinary strategies. However, we acknowledge we are in the early stages of transforming structures and practices, and much more needs to be done.
Attendance Disproportionalities 2021-2022
Why is it important?
There is a great deal of research on attendance and its impact on students. Studies have found that when students are absent from school, they miss instructional time which makes them more likely to fall behind their peers and be disengaged from school. Students with high absenteeism are also more likely to leave school early (i.e., drop out of school) and are less likely to graduate high school. Leaving school early is associated with negative outcomes later in life, such as unemployment, precarious or low-paying jobs, and limited access to postsecondary education.
Background
There is a strong relationship between student attendance and achievement. If students attend school regularly, they have opportunities to learn and are shown to have higher levels of achievement compared to students who frequently miss school. Absenteeism is considered “chronic” or “persistent” if students miss 10% or more than 19 days of school (based on 194 instructional days) in one year. Students who are persistently absent are less likely to pass courses, attain credits, and be prepared for learning in future courses or grades.
Students may miss school for a variety of reasons including illness, COVID-19 isolation, injury, religious/creed observances, vacation, and truancy (truancy means missing school on purpose without a valid reason). Students may also miss school for reasons that are less visible, such as to avoid a bully at school, to care for younger siblings while a parent picks up an extra shift at work, to avoid using a bathroom that is not appropriate for their gender identity, or because they don’t feel connected to what they’re learning in class. When we see patterns of high absences in a particular group of students, educators must examine what is happening in those students’ lives and their experiences at school that is affecting their attendance. How can the school environment be improved for students to feel safe and welcome? How can students be encouraged to feel engaged in their learning? How can students and families be supported to address barriers to attending school?
How to read the charts
We have used “jitter plots” to represent the data because they show how varied attendance is from student to student. Each dot in the chart represents an individual student and the number of days that student was absent. The dots are clustered in bars to represent students within an identity group. The large orange dot within each cluster or bar represents the average number of school days missed for students within that identity group. To learn more about what a jitter plot does, see Appendix A provided with this report.
We compared the average number of absences for each identity group with the average number of absences for all students in the Board (represented by the orange line, also called the “board average”). Where the average number of absences is more than the Board average (i.e., above the orange line), it signals that students within that group are underserved by our education system.
The data show trends we expect to see in the whole student population. The averages are statistically significant and the number of students in each identity group is high enough that we can be reasonably sure these results are not due to chance. To see all identity groups and data, go to the data table in Appendix B.
Days Absent per Student by Identity Group
Average number of days absent:
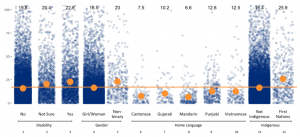
Graph Legend
| 1 | No | 5 | Non-Binary | 9 | Punjabi |
| 2 | Not Sure | 6 | Cantonese | 10 | Vietnamese |
| 3 | Yes | 7 | Gujarati | 11 | Not Indigenous |
| 4 | Girl/Woman | 8 | Mandarin | 12 | First Nations |
Graph Legend
| 1 | East Asian | 5 | White | 9 | Indigenous Spirituality | 13 | Gay or Lesbian |
| 2 | Lation/a/x | 6 | Buddhist | 10 | Other | 14 | Heterosexual |
| 3 | South Asian | 7 | Christian | 11 | Sikh | 15 | Pansexual |
| 4 | Southeast Asian | 8 | Hindu | 12 | Bisexual | 16 | Transgender |
It’s important to remember that individual students within a group do not all have the same experience. Although the averages show us an overall pattern of attendance, you can see by the dots that some students within a group may have missed a lot of school days, while others in that same group may have only missed a few days.
Here is an example of how to read the chart: We see that the Board average for days absent in 2021-2022 is 17.2 days. When we look at Indigenous Spirituality under the Religion category, we see an average absence rate of 29.5 days which is much higher than the Board average and very concerning. However, when we look at the dots, we see that most of them are clustered below the Board average. What we understand by this is that there are probably a few students with extremely high absence rates which pulls up the average for the whole group. This signals us to focus on understanding more about what is affecting their attendance.
Findings
- On average, schools report more absences for students who identify as:
- Living with a disability or unsure of their disability status
- First Nations
- Latina/Latino/Latinx
- Indigenous Spirituality or “Other” religions
- Transgender
- Bisexual, Gay or Lesbian, or Pansexual
What does this mean?
The data clearly show patterns of disparity across some identity groups in terms of attendance. Ensuring that the learning environment is serving all students and that they feel welcome, safe, included, valued and engaged is ongoing work. We know we have much to do to create the kind of learning environments we want to provide. Throughout the 2023-2024 school year HWDSB will be collaborating with students, parents/guardians, educators and community partners in updating the Equity Action Plan and on the development of the three-year Mental Health Strategy. Using the information from this data, these plans will have specific strategies to understand and address the disparities in attendance and engagement.
Achievement Disproportionalities 2021-2022
Why is it important?
The Ontario Ministry of Education commissioned research studies in the early 2000s that brought attention to graduation rates among Ontario’s secondary school students and what factors influence whether or not a student graduates. One study found that students who do not obtain all of their grade 9 credits (students are expected to obtain 8 credits by the end of grade 9) are far less likely to graduate. Another study found that the reasons for students leaving school early and not graduating had more to do with their disconnection with and disengagement from school rather than their personal and family circumstances. Early student learning is a predictor of later student learning. Elementary achievement is just as important as secondary credit accumulation in shaping educational outcomes for students.
We know our education systems work for certain groups of students but less so for others. When we see that a student’s ability to succeed in school differs because of their identity, we must examine what aspects of our school system are not serving certain groups of students and how this is impacting their futures.
Background
The Ontario Ministry of Education provides guidance for educators on how student learning and work is to be evaluated, and marks assigned. They have also determined what level of achievement is necessary for students to be considered to have demonstrated the knowledge and skills necessary to be prepared for their next year or course. This is called the “provincial standard” and is a Level 3. It is the same as a mark in the B range or 72-78%.
Student achievement is affected by several factors beyond someone’s ability to learn or do well on a test. While students’ personal factors, including motivation to learn and relationships with peers and educators impact their success, there are larger systemic factors that determine their success, including class size, quality, effective and culturally responsive instructions, and inclusive and welcoming school environments. When we see patterns of low achievement in a particular group of students, we must examine why the disparities are occurring and how we can better support student learning.
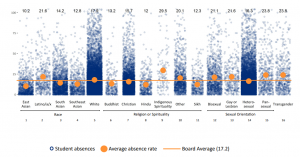
How to read the charts
We have used a “jitter plot” to represent the data because it shows how varied achievement is from student to student. Each dot in the chart represents individual students and each student’s average final grade. The dots are clustered within identity groups. The large orange dot represents the average final grade for students within each identity group. To learn more about what a jitter plot does, see Appendix A of this report.
The data show trends we expect to see in the whole student population. The averages are statistically significant and the number of students in each identity group is high enough that we can be reasonably sure these results are not due to chance. To see all identity groups and data, go to the data table in Appendix B.
Average Grades per Student by Identity Group
Average grades:
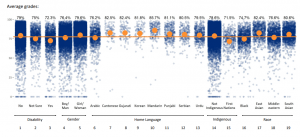
| 1 | No | 6 | Arabic | 11 | Punjabi | 16 | Black |
| 2 | Not Sure | 7 | Cantonese | 12 | Serbian | 17 | East Asian |
| 3 | Yes | 8 | Gujarati | 13 | Urdu | 18 | Middle-eastern |
| 4 | Boy/Man | 9 | Korean | 14 | Not Indigenous | 19 | South Asian |
| 5 | Girl/Woman | 10 | Mandarin | 15 | First Nations |
| 1 | Agnostic | 5 | Indigenous Spirituality | 9 | Gay or Lesbian | 13 | No |
| 2 | Atheist | 6 | Jewish | 10 | Heterosexual | 14 | Not Sure |
| 3 | Christian | 7 | Sikh | 11 | Pansexual | 15 | Yes |
| 4 | Hindu | 8 | Bisexcual | 12 | Queer |
We compared the average grade for each identity group with the average grade for all students in the Board (represented by the orange line, also called the “board average”). When the average grade is less than the Board average (i.e., below the orange line), it signals that students within that group are underserved by our education system.
It’s important to remember that individual students within a group do not all have the same experience. Although we see an overall pattern of achievement, some students within a group may be assigned high grades, while others in that same group may be assigned low grades.
Here is an example of how to read this chart: We see that the Board average for overall grades at the end of the 2021-2022 school year is 77.7%. When we look at girls and boys, we see that the averages are clearly above the Board average for girls and below the Board average for boys. This is concerning on its own and warrants investigating more deeply. However, we also see from the dots in the plot that lots of boys and girls are assigned high grades and many boys and girls are assigned low grades. This signals us to learn more about which girls and which boys are being assigned low grades.
Findings
- On average, schools assign lower grades to students who identify as:
- Living with a disability, or not sure about their disability status (see the data table for average grades by disability type)
- Boys
- Arabic speaking
- First Nations
- Black or Middle Eastern
- Indigenous Spirituality
- Bisexual, Gay or Lesbian, or Pansexual
- Transgender, or not sure if Transgender
What does this mean?
Our data reveal that some groups of students are underserved in terms of their learning and achievement in school. We believe that we need to look more deeply at this issue across all ages of students and different areas of study to understand more fully where we can use interventions to improve our services to all students. For example, early reading skills for primary students is a key achievement that provides the foundation for all students’ learning throughout elementary, secondary and post-secondary. Some interventions to address the learning environment are detailed at the end of this report. There are other targeted programs in place as well, for example, early reading strategies and tutoring programs.
Knowing if our teaching and learning environment is negatively impacting specific identity groups will help us to affect change in targeted ways. Part of this work involves the regular collection of identity data so that we can do more in-depth analyses and monitor our progress as we work toward transforming our structures and practices.
Well-Being Disproportionalities 2021-2022
Why is this important?
When students experience a positive school climate, they are more likely to have higher levels of well-being, which in turn promotes their success in the classroom. Academic research literature on well-being tells us that student well-being is related to their participation at school and is affected by factors like their perceptions of being listened to, of having a say at school, of being valued and respected. Although student well-being is an outcome of their experiences at school, in the community and at home, we focus on it at school because of the impact it has on student engagement which is linked to attendance which is linked to achievement. When we see a pattern of low well-being in particular groups of students, we take this as an indication that school environments are not environments in which all students can thrive, and we need to address that.
Background
Students succeed when there is a positive environment for their learning. The Ontario Ministry of Education states that a positive learning environment or “school climate” exists when everyone in the school feels safe, included, accepted, and respected; when positive behaviours and interactions are promoted; and when equity is embedded in students’ learning.
The Ontario Ministry of Education requires that school boards gather feedback on school climate every two years to understand how students, parents and staff feel about the school community. One of the tools HWDSB has used to assess student perceptions of school climate is called the “Middle Years Development Instrument (MDI).” The MDI is a self-report questionnaire developed by University of British Columbia’s Human Early Learning Partnership, and it was used to ask students in Grades 4-12 about their well-being at school and in the community. We used one of the sections in the MDI, called the “Well-Being Index,” to report on well-being in this report.
The Well-Being Index provides a summary of students’ social, emotional and physical health. It combines five measures related to optimism, happiness, self-esteem, absence of sadness and general health. It can result in three categories of well-being: “thriving” (or high) well-being, “medium to high” well-being, or “low” well-being. To be in the thriving category, students must report positive responses on four of the five measures that make up the Well-Being Index.
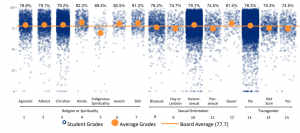
How to read the chart?
The bars on the chart represent the proportion of students who scored “high” or “thriving” on the Well-Being Index within an identity group. We compared the proportion of students with high well-being for each identity group with the proportion of students with high well-being for all students (represented by the orange line, also called the “board average”). When the proportion of “thriving” or “high” well-being students in an identity group is below the Board average (i.e., the bar is below the orange line), it signals that students within that group are underserved by our education system.
The data show trends we expect to see in the whole student population. The proportions are statistically significant and the number of students in each identity group is high enough that we can be reasonably sure these results are not due to chance. To see all identity groups and data, go to the data table in Appendix B.
Proportion of Students in each Identity Group that Measure “High”on the MDI Well-Being Scale
| 1 | Yes | 6 | Girl | 11 | Athiest | 16 | Pansexual |
| 2 | No | 7 | Non-Binary | 12 | Christian | 17 | Queer |
| 3 | Not Sure | 8 | Not Sure | 13 | Bisexual | 18 | Yes |
| 4 | Boy | 9 | Serbian | 14 | Gay or Lesbian | 19 | Not Sure |
| 5 | Genderfluid | 10 | Agnostic | 15 | Heterosexual |
Here is an example of how to read this chart: Across all the students in our Board who both submitted Student Census data and filled out the MDI, 22.9% of them scored “high” or “thriving” on the well-being index. In the “Gender” category, we can see that 27.5% of students who identify as boys report having a high well-being, which is greater than the Board average. We also see that a low proportion of students who identify as non-binary (3.3%) and students who are genderfluid (3.1%) report having a high well-being. These low proportions are concerning as they are far below the Board average.
Findings
- On average, schools see a lower well-being for students who identify as:
- Living with disabilities (See Appendix B for full details)
- Genderfluid, Girls, Non-Binary, or not sure of gender identity
- Agnostic, or Atheist
- Bisexual, Gay or Lesbian, Pansexual, or Queer
- Transgender, or not sure of Transgender status
What does this mean?
The disproportionalities we see in the wellbeing data are in keeping with disproportionalities we see across other measures. Examining our school environments to identify and address systemic factors that contribute to creating disparities in student wellbeing is part of our continuing effort to affect transformative change so that schools are safe and welcoming spaces for all students.
These well-being disproportionality data paired with student voices are foundational in the creation of the three-year Mental Health Strategy.
We have a lot of work to do. Our new strategic directions (January 2024), based on feedback we heard from our families, students, staff and communities, will set the intention and purpose for HWDSB to actively work toward ensuring every student feels a deep sense of belonging and has joyful learning experiences while recognizing that students have different needs and identities.
Staff will monitor and evaluate the effectiveness of initiatives across the Board to eliminate barriers, in alignment with the ARDS. Staff will also dig deeper into intersectionalities to understand the experiences of students across multiple identity groups (e.g., students who identify as both disabled and racialized) as we work alongside students, families and the broader community. To that end, there will be a yearly student identity data collection in three grades and at registration. Again, all identity-based data collection is voluntary. Students and parents/guardians can choose to have their data excluded from our student identity dataset. However, we hope that the HWDSB community will see the value and purpose in building this data set over time.
Some of the initiatives we have put in place currently to identify and address inequities as guided by the Board Equity Action Plan are described below. As we advance down our pathway of confronting bias, colonial structures, systemic racism and oppression in our Board and the broader education sector, we will further develop responses in the form of programming, professional development, and strategies that create more equitable learning experiences for students. All this is to say that we are at the beginning of this work and have a long way to go. We are committed to a focused long-term effort to redress inequities through widespread awareness and effective practices.
The purpose for this report is to communicate what we found in our data—the disproportionalities—and to provide context for understanding them. Going forward we need to develop shared solutions that recognize the complexity and interdependency of systems of oppression in schools, in communities, and in organizations. Our work is also to focus our interventions and be more specific about how interventions, like the ones described below, are targeting specific findings in our data. Most of the programs below are new over the past couple of years and need some time to see the impacts.
Student well-being and achievement are impacted by factors beyond the walls of the classroom. Students’ experiences in school are linked to their family environment, the neighborhood they live in, and the communities they belong to. To better understand the priorities, concerns, needs and interests of students, particularly those who have been underserved in our schools as this disproportionality report depicts, continued collaboration with communities is our priority. Community engagement is also advised by the Anti-Racism Data Standards (ARDS), as it promotes the collection, management, use and analysis of data in ways that align with cultural contexts and lived experiences of students.
Some Examples of Current Initiatives
Reimagining Wellness
Reimagining Wellness is a series of activities and lessons that foster classroom community, safety, inclusion and belonging that teachers implement during their classes throughout the day. Themes cover self-care, managing emotions, personal and collective identity, collective empowerment and collective action.
Monthly Learning Sessions
Monthly learning sessions for principals, vice-principals and system leaders to strengthen their understanding in areas such as Human Rights, Anti-Black Racism, and HWDSB’s Indigenous Education Circle Strategic Action Plan (IECSAP).
Cultural Responsive Relevant Pedagogy
Culturally Responsive Relevant Pedagogy (CRRP) in classrooms is the use of cultural characteristics, experiences, and perspectives of all students as conduits to teach them more effectively. It builds on the lived experiences of students to both motivate them and meet their unique needs.
Indigenous Education and Indigenous Cultural Safety Programs
Indigenous Education and Indigenous Cultural Safety programs including a culturally immersive learning pilot called The Learning Nest in which Indigenous ways of knowing, being and doing are respected, valued and prioritized.
Graduation Coaches for Black Students
Graduation Coaches for Black Students provide dedicated culturally responsive space for Black students to develop community, centre student voice to increase student engagement and to understand and eliminate barriers for students. Through formal and individualized support and coaching of a cohort of students, coaches curate success plans alongside their students aimed at student achievement, regular attendance, and credit accumulation.
Behaviour Analytics Services
Behaviour Analytics Services was introduced in the fall of 2020. It is an interdisciplinary team comprised of Board Certified Behaviour Analysts (BCBAs), Child & Youth Care Practitioners (CYCPs), Teachers, Educational Assistants, Designated Early Childhood Educators (DECEs) who work collaboratively with school staff to design behavioural support strategies that help student learning. The team works closely with school staff and directly with students with a wide range of neurodiversity, who have significant difficulty with social, emotional, and behavioural regulation.
AIM: Accept, Identify, Move Curriculum
AIM: Accept, Identify, Move Curriculum is a program that offers support for students who have had frequent difficulty in their regular classroom setting because of significant social, emotional or behavioral issues that have interfered with their own academic success and the success of their peers. It is currently offered in 31 elementary schools. Students work together with the AIM Child and Youth Care Practitioner (CYCP) in preparing themselves for academic tasks and socially appropriate behaviour. The program is individualized with goals, expectations, and a points reinforcement system.
Project SEARCH
Project SEARCH was introduced in the fall of 2020 and HWDSB is the fourth school board in Canada to implement the program. Project SEARCH is a unique, business-led, one-year program for young people with special education needs who are in their last year of high school. The main objective is to prepare students for employment with job skills training through a combination of classroom instruction and hands-on career training. Since beginning the program, HWDSB’s Education Centre has been the program’s host business site. Interns engage in daily employability skills lessons and targeted internships where they learn competitive, marketable and transferable job skills. They are supported by the Project SEARCH Teacher, two Skills Trainers, as well as Managers and Mentors from the various Board departments. Three different worksite internships are completed throughout the school year with interns working alongside Education Centre staff. Upon graduation, interns are supported by local employment services providers in their journey to secure meaningful jobs in the community.
Student Voice Advisory Committees
Student Voice Advisory Committees are part of the ongoing effort to provide spaces in which students feel safe, supported and accepted. The committees provide a forum for groups that have been historically and currently marginalized by the education system and include groups representing students who are Black, Indigenous, racialized, Two-Spirit and LGBTQIA+, students with disabilities and faith-based groups. For example, the Positive Space Student Voice Committee is a Two-Spirit and LGBTQIA+ committee of students from across the Board in grades 7 to 12. The work of this committee has resulted in the identification of key concerns for Two-Spirit and LGBTQIA+ students along with some ideas for addressing the issues. Their work is focused on inclusion and representation for queer and transgender Black, Indigenous and people of colour (QTBIPOC) students. In addition, they have provided input/voice on a number of initiatives e.g., Bullying Prevention and Intervention Policy, Naming of Schools Policy, Guidelines for Presentations and Guest Speakers.
Safe School Mentors
Safe School Mentors were introduced in October 2022. They are school leaders trained in safe and secure schools who provide guidance and mentorship to other school leaders. This includes supporting principals and vice-principals regarding safe and inclusive environments, suspension/expulsion processes and responding to hate/bias, and secure schools.
Voices Against Bullying Pilot
Voices Against Bullying Pilot: In 2020, HWDSB staff began meeting with a community-based organization called Voices Against Bullying (VAB). VAB began as an online parent/guardian/caregiver peer support network for families who had a child who experienced bullying. This group evolved to provide informal support to families. Recognizing that education systems can be challenging to navigate, oppressive and sometimes harmful, staff have been looking at ways to eliminate barriers for families and to change oppressive structures. With funding from the Hamilton Community Foundation and infrastructure support from the YMCA, VAB launched the family advocacy and support program in February 2023. As part of our ongoing collaboration, VAB met with a group of principals and vice-principals to seek input around the nature of the program, referral process and operational elements. VAB volunteer advocates have been trained in basic emotion coaching, simple mediation and HWDSB policies and procedures. The goal of the program is to facilitate conversation between the home and school where there has been an incident of bullying and where the family is looking for support.
Recess Guardians
Recess Guardians is a program that was designed to empower children and youth through active play. It was piloted in 4 schools during 2022-2023 with plans to expand across more schools in 2023-2024. We know that unstructured break times such as recess are when a lot of students feel unsafe. Recess Guardians provides an opportunity for students (Kindergarten to grade 3) to participate in inclusive, student led (grades 5 to 8) activities, supported by a staff mentor. The program includes training and ongoing support for the student facilitators and staff mentor. The result is more students participating in collaborative play at recess and feeling included and safe.
Appendices
Additional Links
- Disproportionality Data (CSV)
- Full Disproportionality Report
- We All Count: HWDSB Student Census 2021
- We All Count: HWDSB Student Census – Glossary
Translated PDF Reports
- About Disproportionalities and Translation Instructions-ARABIC
- About Disproportionalities and Translation Instructions-CHINESE – SIMPLIFIED
- About Disproportionalities and Translation Instructions-FARSI
- About Disproportionalities and Translation Instructions-FRENCH – CANADIAN
- About Disproportionalities and Translation Instructions-KAREN
- About Disproportionalities and Translation Instructions-KOREAN
- About Disproportionalities and Translation Instructions-KURDISH – SORANI
- About Disproportionalities and Translation Instructions-SOMALI
- About Disproportionalities and Translation Instructions-SPANISH – LATIN AMERICA
- About Disproportionalities and Translation Instructions-URDU
- About Disproportionalities and Translation Instructions-VIETNAMESE
Updated on Wednesday, March 20, 2024.